To assess progress toward improving water quality, scientists use ecosystem indicators to measure whether things are getting better, worse, or staying the same.
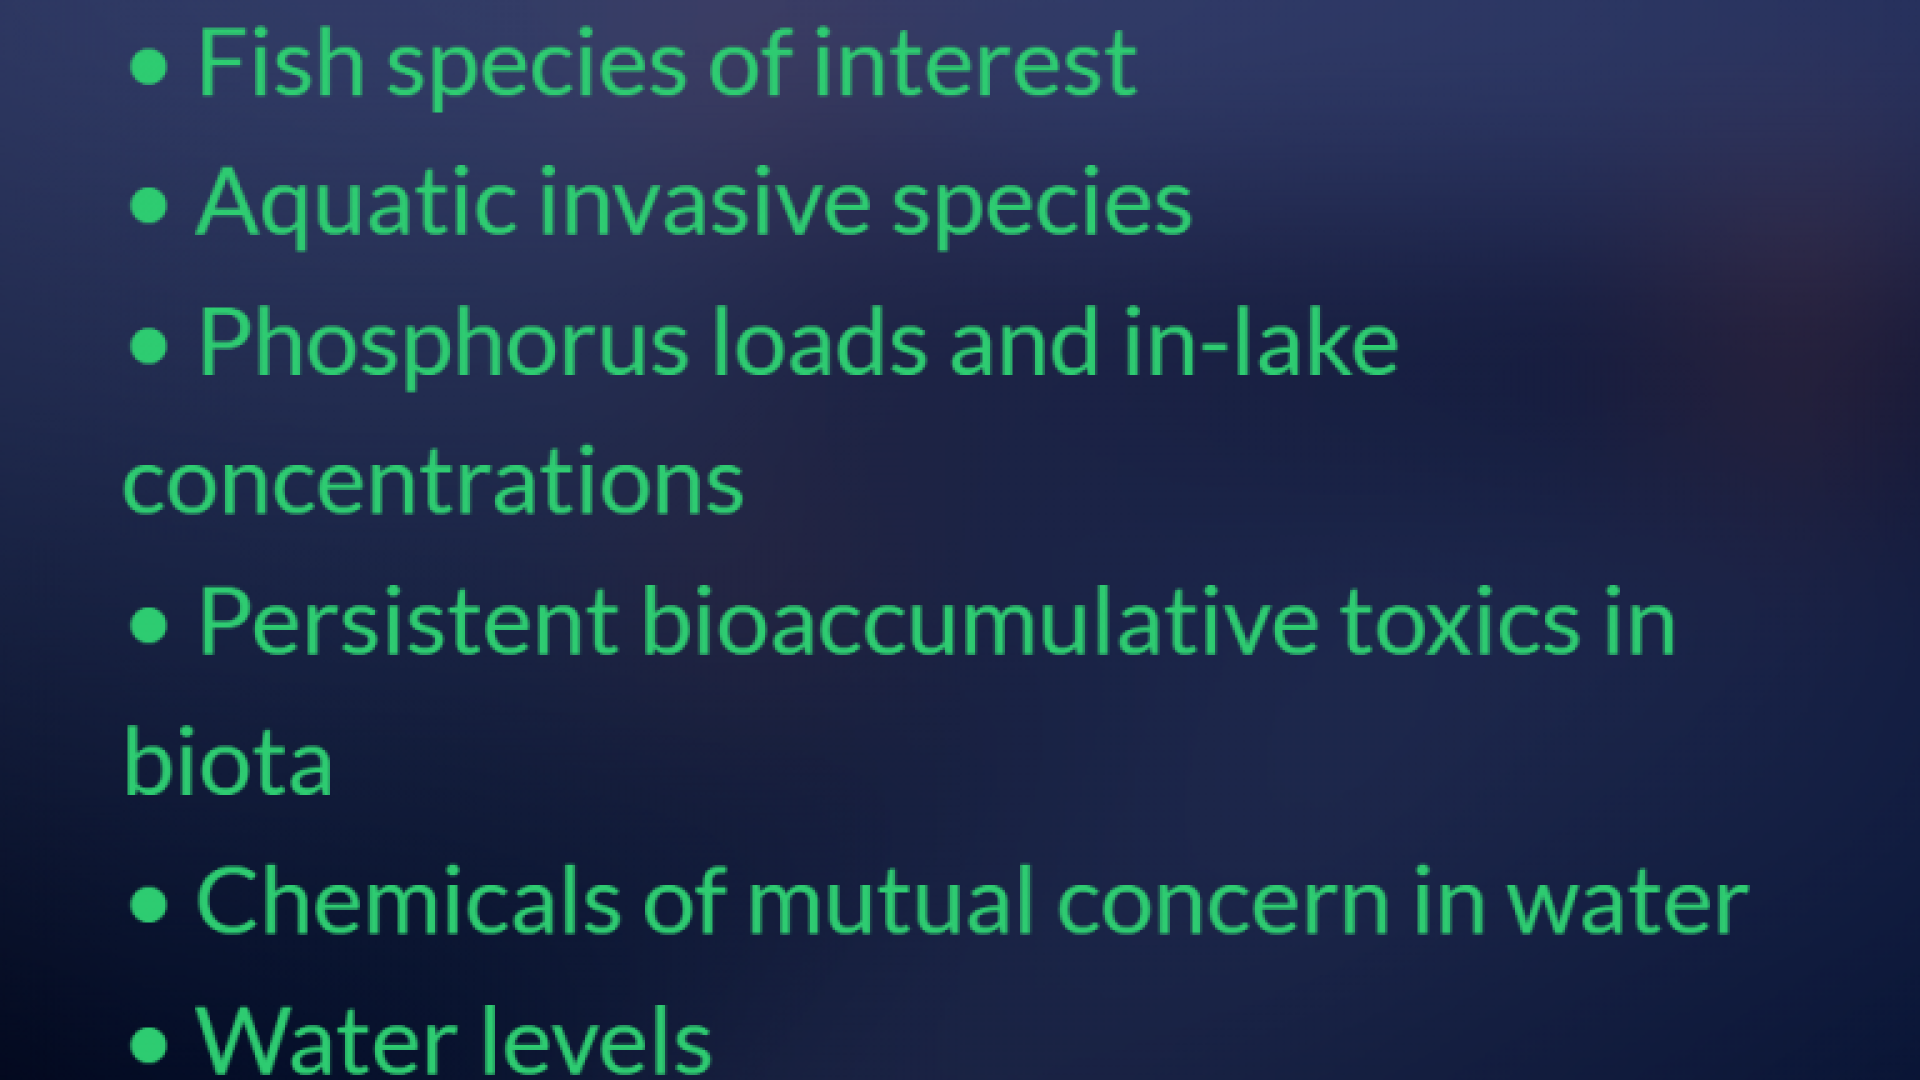
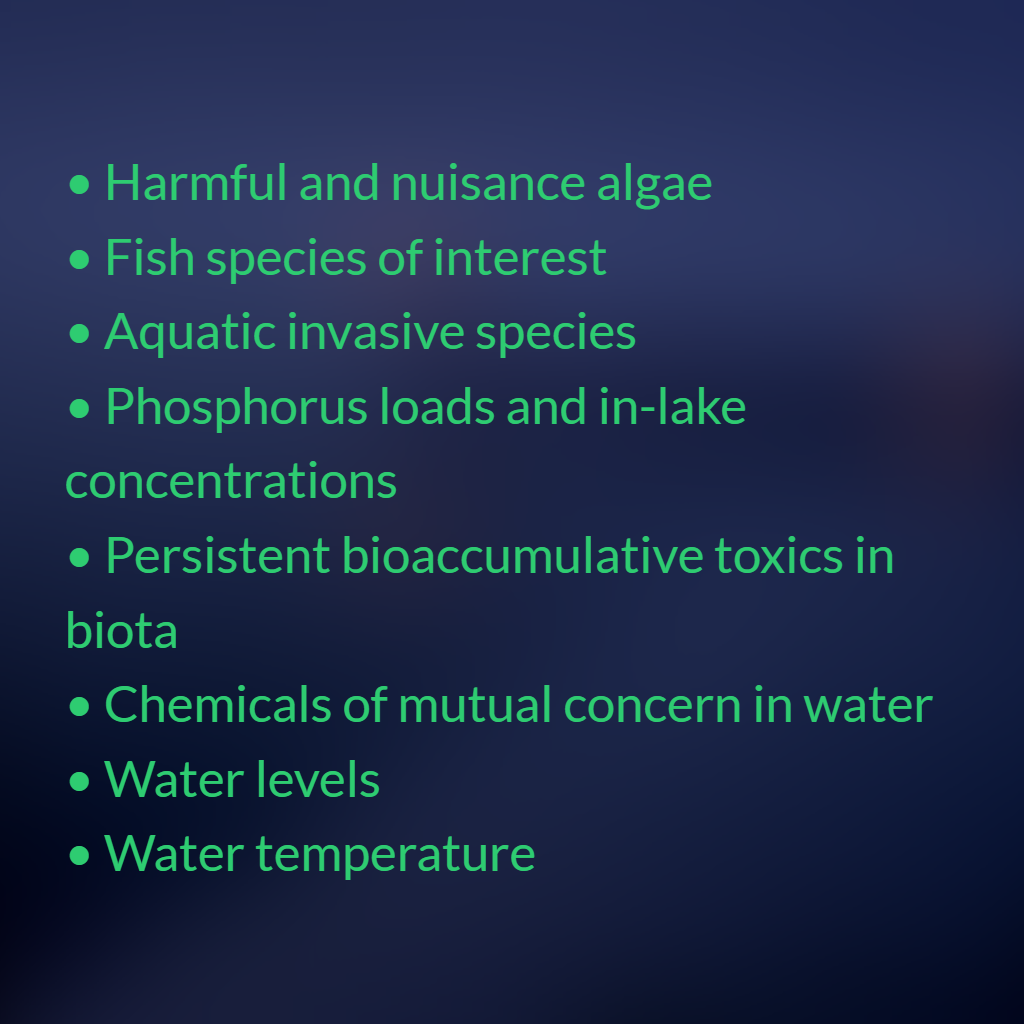
The IJC’s Great Lakes Science Advisory Board is completing a process to identify a subset of 16 indicators that can be used to communicate progress toward improving the health of the Great Lakes. That list is pared down further to eight indicators – the fewest that tell us the most – that address biological, chemical and physical integrity:
How can examining these indicators provide useful information on how the Great Lakes are doing?
Take, for example, chemicals of mutual concern in water. This indicator measures the concentrations of legacy chemicals such as polychlorinated biphenyl compounds (PCBs), mercury, and flame retardants.
Concentrations of these chemicals in water are measured at strategic locations on regular time intervals within the basin. From the measured data, trends and patterns can be determined; such as whether the presence of a chemical is increasing or decreasing over time; or if the chemical is more highly concentrated in the water closer to or further away from land.
These chemicals of mutual concern in water matter because their concentration can give us insight as to where chemicals in an ecosystem came from and where they are headed. Models can be used to help pinpoint if a particular chemical is coming into the lake from a local or a global source, which occurs when contaminants are transported through the atmosphere.
For example, in Lake Erie, we know that relatively local sources (tributaries) are responsible for much of the pollution in the lake. We know that Lake Superior tends to be affected more by global pollutants transported through the atmosphere. Models also can be used to estimate what chemical concentrations might be in endpoints such as drinking water and fish, which are consumed by humans and other animals. Ultimately, this information is useful for telling people if the lake (or areas of the lake) is safe for drinking, swimming, and fishing, and whether or not the status is improving over time.
Figures 1 and 2 provide information on mercury in the Great Lakes. Mercury is on the two governments’ proposed list of Chemicals of Mutual Concern. In the upper Great Lakes, the source of mercury is precipitation; in the lower lakes, the source of mercury is industrial activity and watershed runoff.
This is one example of the Board’s work on how to communicate the indicators of Great Lakes health. The Board’s report on this study will be available on the IJC website in the coming weeks.
The IJC’s role under the Great Lakes Water Quality Agreement is to analyze information provided by the governments, assess the effectiveness of programs in both countries and report on progress toward meeting the Agreement’s objectives.


Ankita Mandelia served as the Sea Grant Fellow for the IJC for a one year term, from 2015 into 2016.
Subscribe to our Newsletter!